Debug across languages in one session. Profile guest code, inspect the shared heap, and diagnose JIT behavior, regardless of language.
Elide brings Truffle’s shared debugger, profiler and coverage tools to guest execution. Each language implements a common instrumentation contract; Elide supplies shared configuration and reporting. Native Image monitors and native profilers extend that view into the managed runtime and machine code.[1][2]
One suite of consistent tools
Truffle languages expose source locations and standard tags for operations such as calls and statements. Instruments use those tags to observe execution through one API. Graal can inline instrument dispatch with guest code.[1]
Elide exposes debugging, profiling, coverage and Insight through its CLI. MCP exposes Insight through the same engine instrument API, giving agent clients access to execution instrumentation.[3][4]
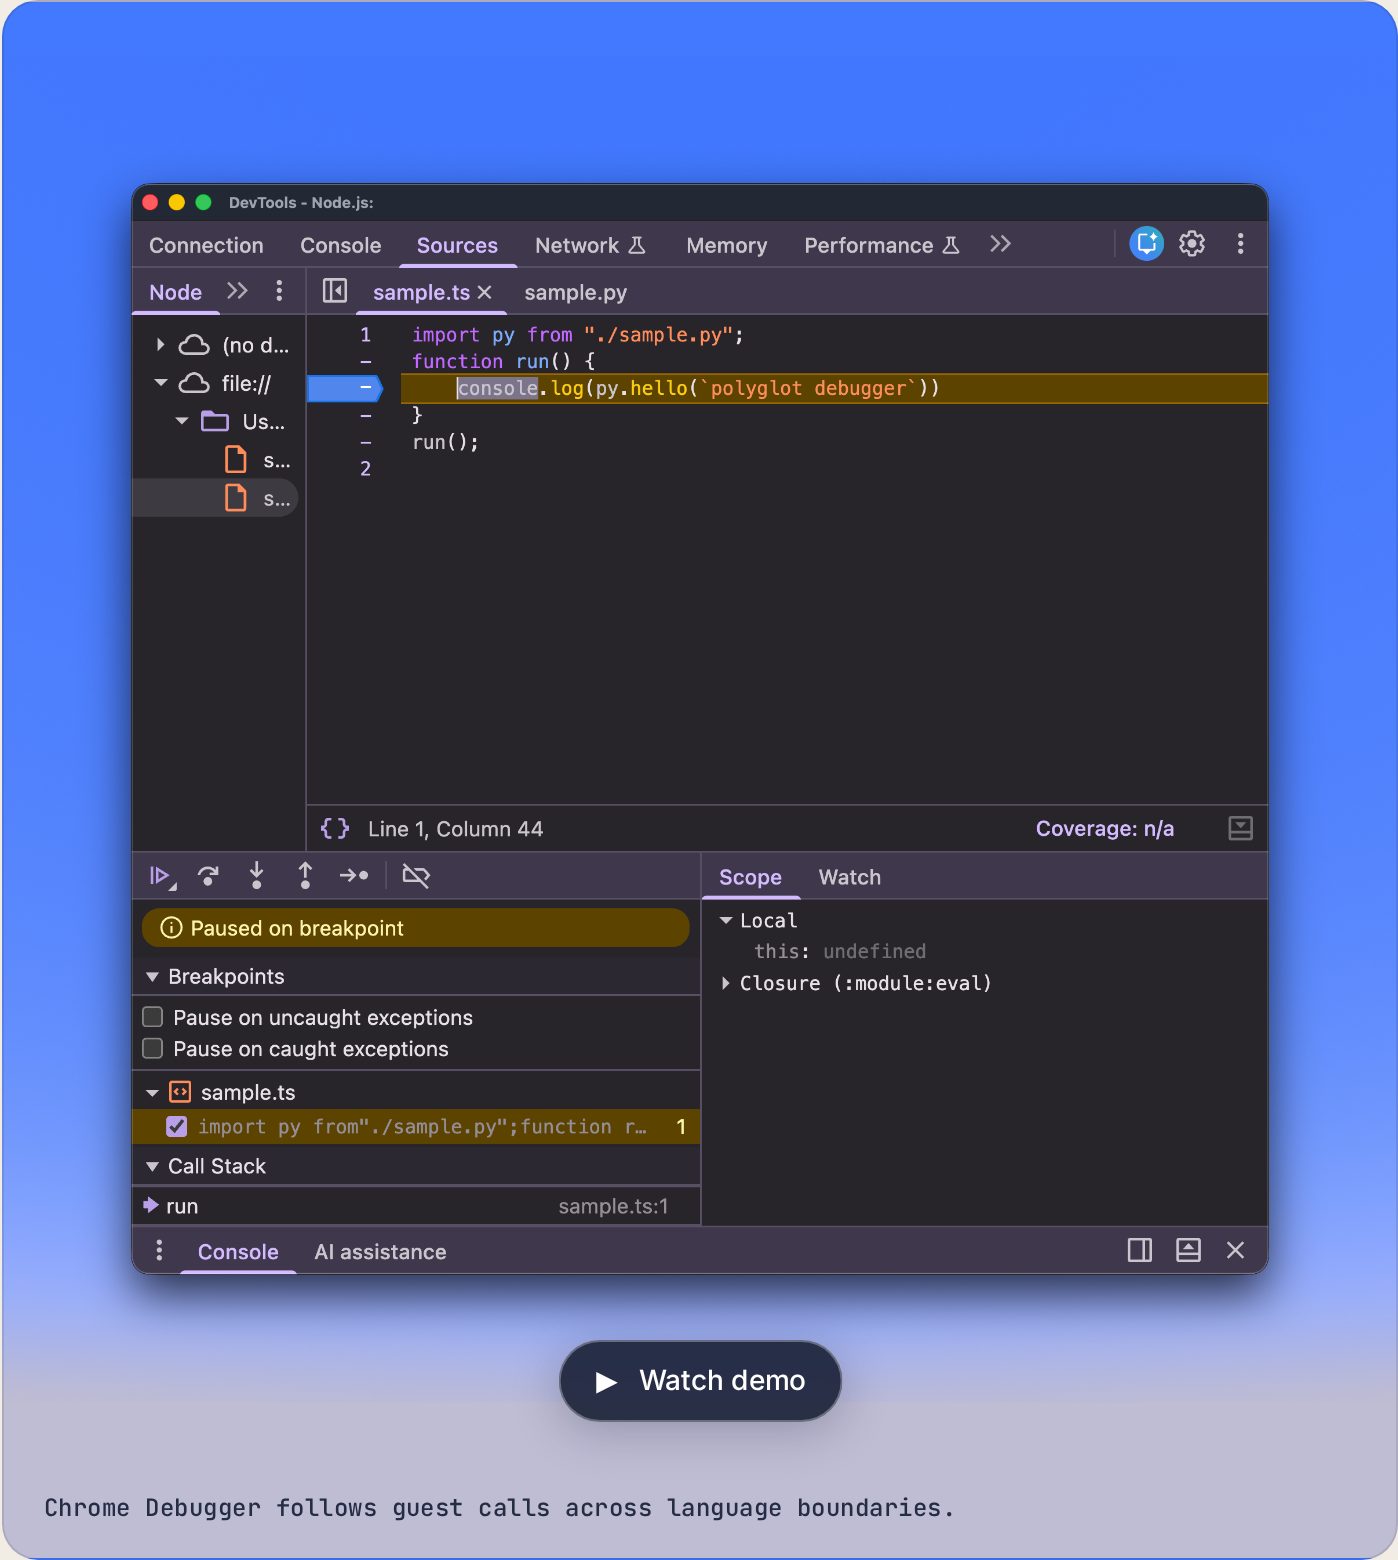
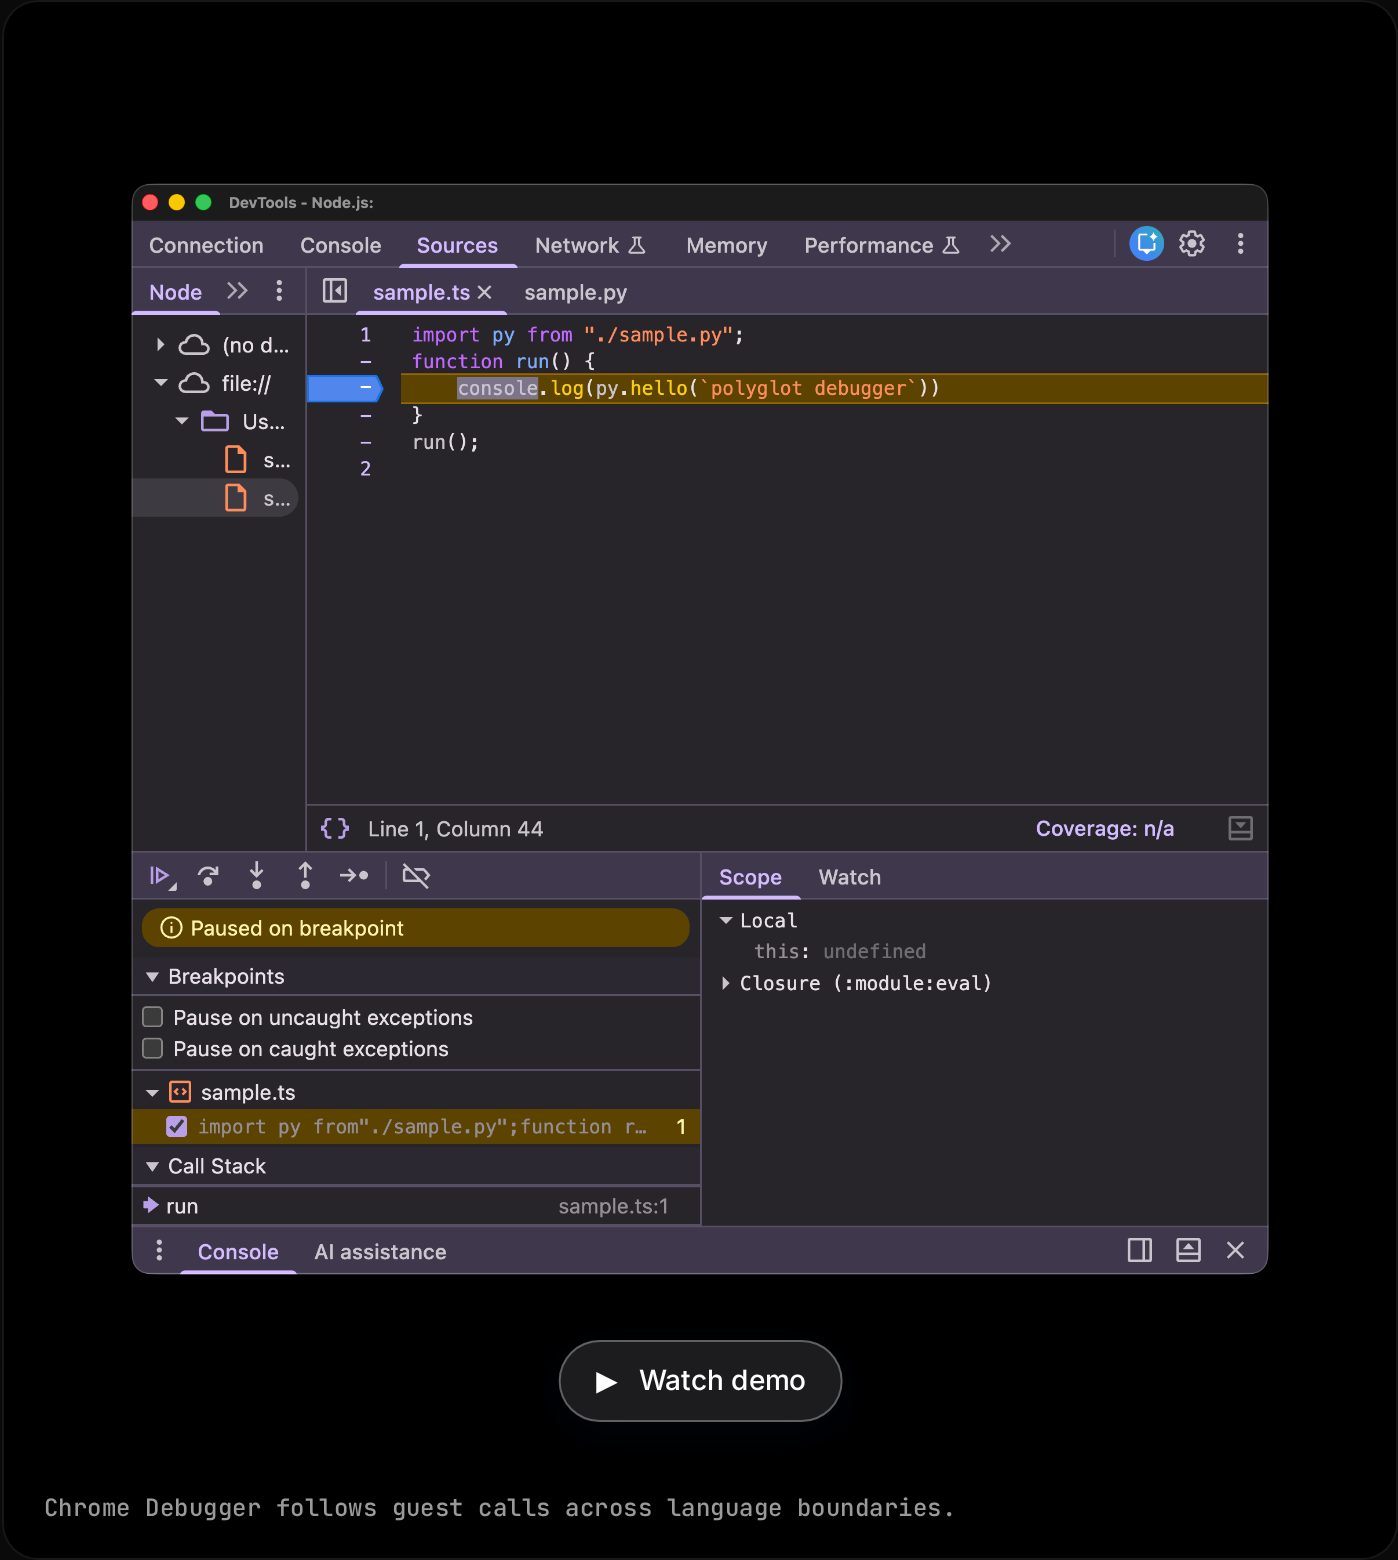
Chrome Debugger works across languages
Step through cross-language calls, inspect variables and read guest stacks in one Chrome Debugger session. Elide’s CDP debugger connects Chrome to guest execution.[5]
Insight works across languages
Insight lets a privileged script observe execution across languages. Callbacks can inspect and modify guest locals.[6]
One agent observing two targets, captured on macOS ARM64 with Elide 1.5.0+20260902.bac3ab38; both runs exited successfully.[11]
observe.js
insight.on("source", (source) => {
  if (source.name === "target.js" || source.name === "target.py") {
    console.log(`Observed source: ${source.name}`);
  }
});
target.js
function twice(value) {
  return value * 2;
}
console.log(`Result: ${twice(21)}`);
target.py
def twice(value):
    return value * 2

print("Result: " + str(twice(21)))
$ elide run --insights=observe.js target.js
Observed source: target.js
Result: 42
$ elide run --insights=observe.js target.py
Observed source: target.py
Result: 42JVM and Rust diagnostics work together
Elide unifies JVM library and Rust logs under one configuration. Its JFR events describe boot, guest execution and HTTP alongside the runtime’s default events. Policy connects these diagnostics to the program’s lifecycle.[7]
Native Image supplies execution samples, runtime events and managed-heap dumps. Linux perf samples native execution stacks; debug symbols and jitdump metadata identify ahead-of-time and runtime-compiled methods.[2][8]
Choose the view that answers your question
| Task | Tool |
|---|---|
| Step through guest code | Chrome inspector or DAP |
| Find where CPU time goes | --profiler=cpusampling |
| Count executions | --profiler=cputracing, also selected by bare --profiler |
| Trace guest allocations | --profiler=memtracing (experimental) |
| Measure exercised code | --coverage |
| Observe execution from a script | Insight through the CLI or MCP |
| Record runtime activity | JFR |
| Find objects retaining memory | Heap dumps and VisualVM |
| Discover the running VM | jvmstat |
| Examine native execution | perf with debug symbols and jitdump |
| Inspect compiler decisions | Compilation tracing and IGV |
Elide supports JFR, jvmstat and heap dumps in the executable, with jcmd on Linux and macOS. Frame pointers support native stack walking.[3][7][8]
VisualVM opens recordings and managed-heap dumps to reveal runtime activity and retained objects. Ideal Graph Visualizer exposes Truffle trees, guest call graphs and compiler phases, connecting source structure to optimization decisions.[9][10]
Sources
- Truffle instrumentation — the common instrument API and execution hooks.
- Native Image Flight Recorder — execution samples, runtime events and custom events.
- Elide CLI instruments — debugger, profiler, coverage and Insight options.
- Elide monitoring and profiling — capture flags, recordings, heap dumps, live capture and perf.
- Elide debugging guide and Chrome Debugger for GraalVM — attaching DAP or CDP; source debugging across Truffle languages.
- GraalVM Insight — observing execution and accessing guest locals.
- Elide monitoring configuration and live capture — built-in monitors, logging and lifecycle events.
- Elide JIT profiling with perf — jitdump metadata and perf for native execution profiles.
- Elide managed-heap dumps — managed-heap inspection in VisualVM.
- Ideal Graph Visualizer — compiler graphs and source relationships.
- Insight example — agent, targets and recorded output.